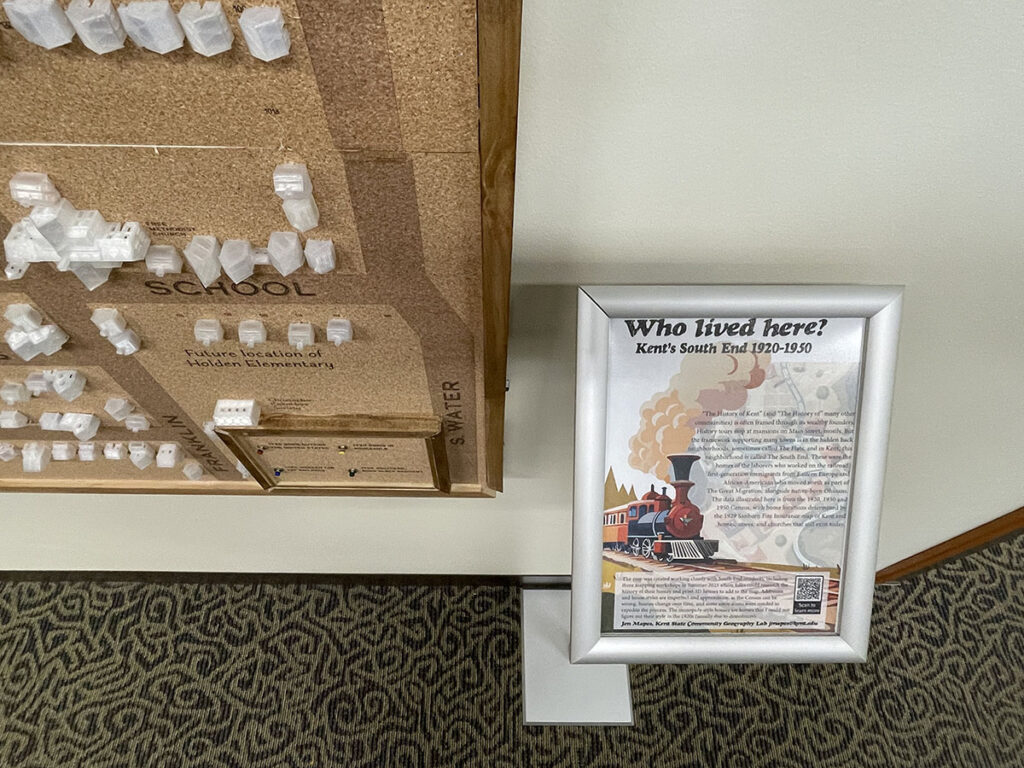
“The History of Kent” (and “The History of” many other communities) is often framed through its wealthy Western European founders. History tours stop at mansions on Main Street, mostly. But the framework supporting many towns is in the hidden back neighborhoods, sometimes called The Flats, and in Kent, this neighborhood is called The South End. These were the homes of the laborers who worked on the railroad: mostly first-generation immigrants from Eastern Europe and African-Americans who moved north as part of The Great Migration.
Part of this project is to build a history that only exists hidden in handwritten census records. Before the 1970s, only large cities shared race, immigration, and employment data through the U.S. Census. Data for everywhere else has only existed in handwritten documents that are released to the public 72 years after they were taken. They can be translated into text with the help of AI but the data still needs to be cleaned and uploaded into a geographic information system (GIS) to be publicly accessible. These records often used by people to learn more about their family tree, but are underutilized as a resource for learning more about the history of neighborhoods and cities. These documents contain rich records of how race, class, language, and labor played out from decade to decade in small towns.
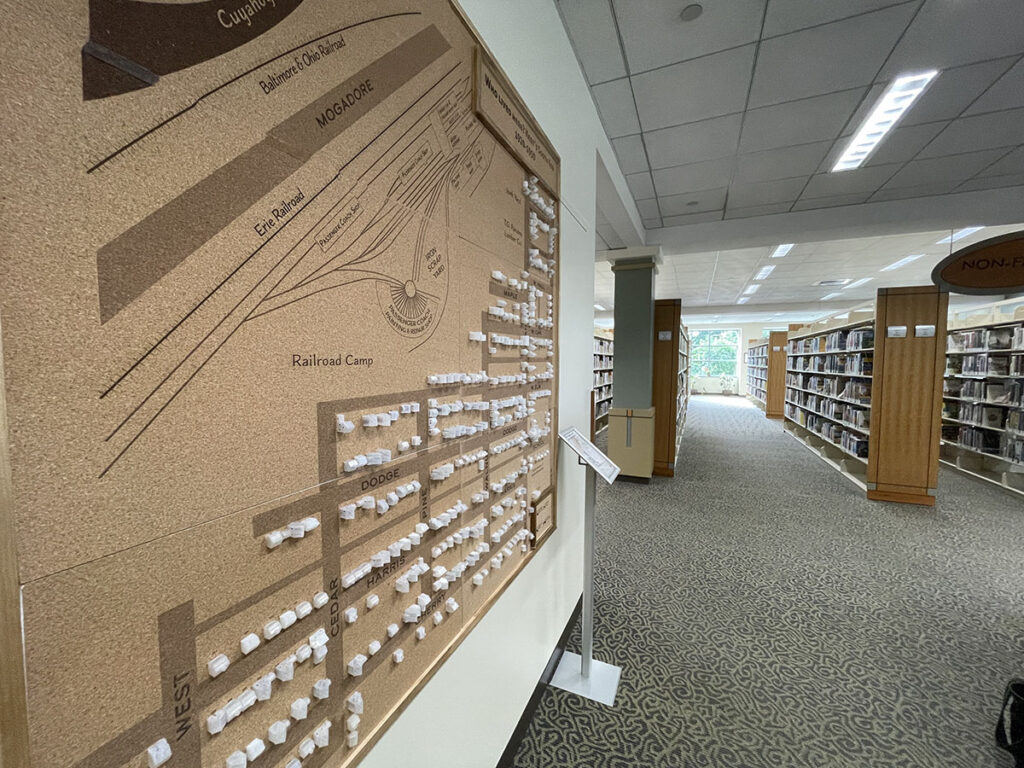
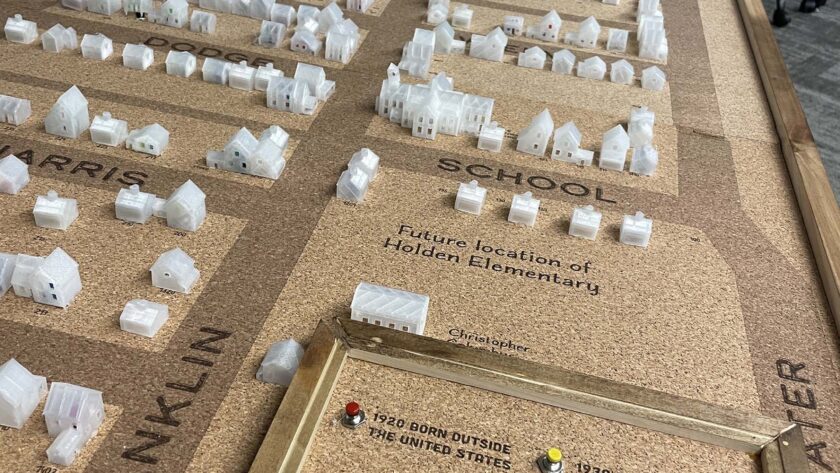
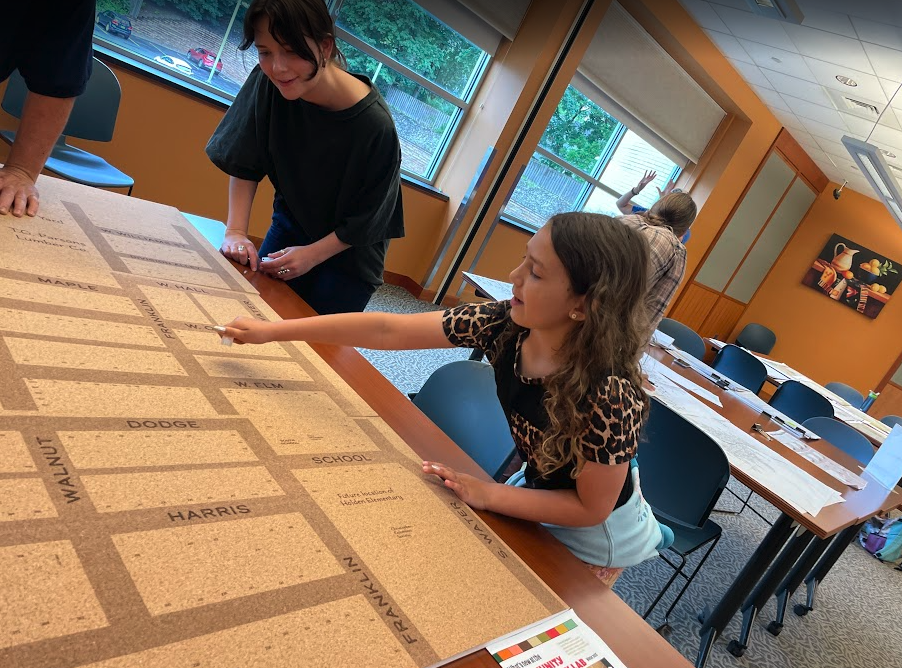
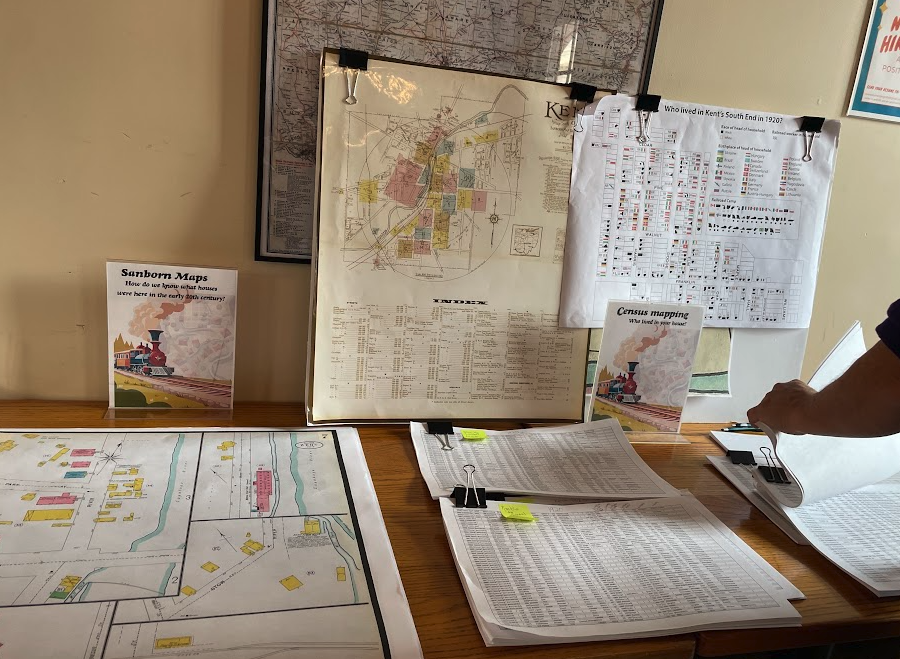
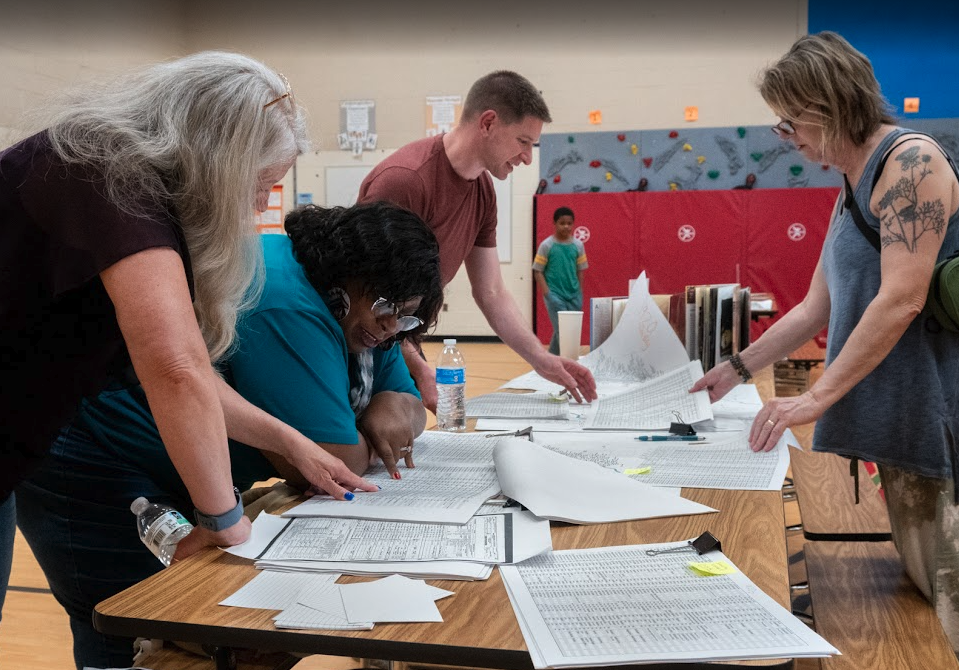
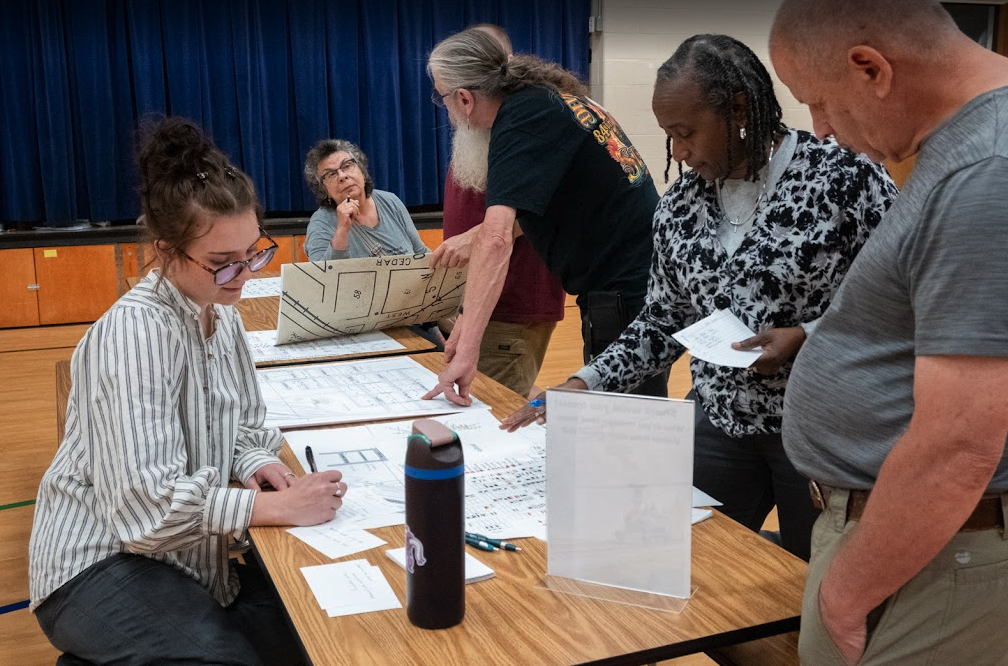
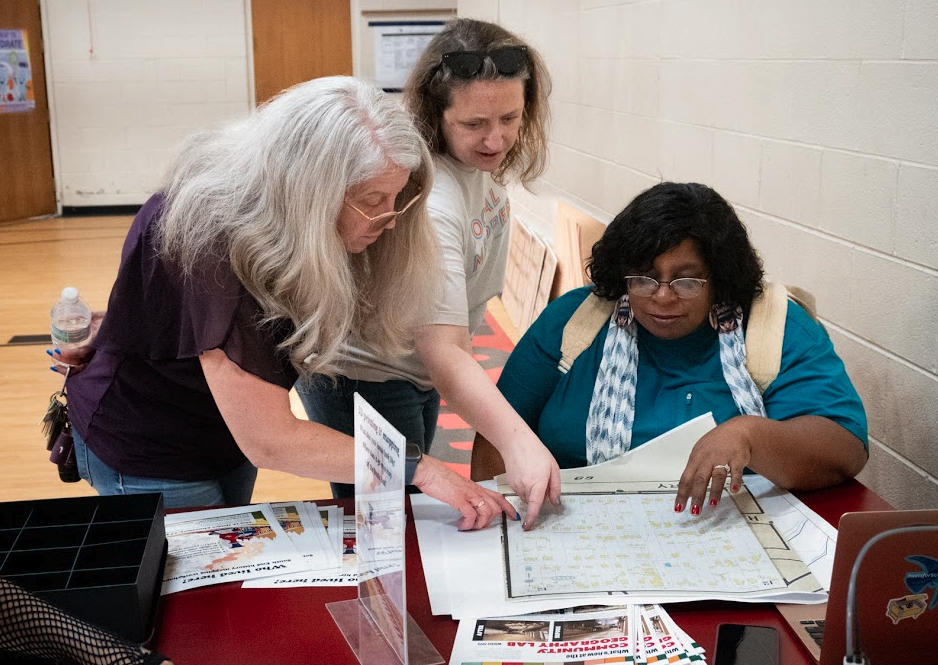
This map was created working closely with South End residents, including three mapping workshops in Summer 2025 where folks could research the history of their homes and print 3D houses to add to the map. These houses were designed using the open source software program Blender to approximate the houses that were there in the decades shown on the map. Their location was estimated using Sanborn Maps, and their style is primarily identified using houses that exist today. Houses that no longer exist are signified with a generic monopoly-style house.
Addresses and house styles are imperfect and approximate, as the Census can be wrong, houses change over time, and some estimations were needed to expedite the process.
This project was inspired by Roger DiPaolo, who first introduced me to the history of the South End, as well as Doria Daniels and Holden Elementary School Principal Todd Poole who were working together to bring South End history to the city’s third grade history curriculum (which currently ignores the South End). Additional inspiration came from working with Bruce Dzeda on Steel Rails, Small Town, making maps of the Kent’s peak railroad infrastructure.
The original idea behind the project was that third and fourth graders could be involved in the mapping, census digitization, 3D house design and circuitry. While time did not permit this amount of engagement for the South End, I hope to write up a guide for elementary school teachers to create a similar project in their own school neighborhoods. I purposefully created this project as something that could be done cheaply, as a form of “analog” GIS, where students are asked to think spatially and consider how regional and national history played out in their own community. I am particularly interested in showing South End kids how the people who lived in their current homes contributed to Kent’s past.
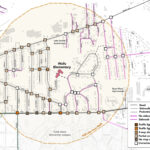
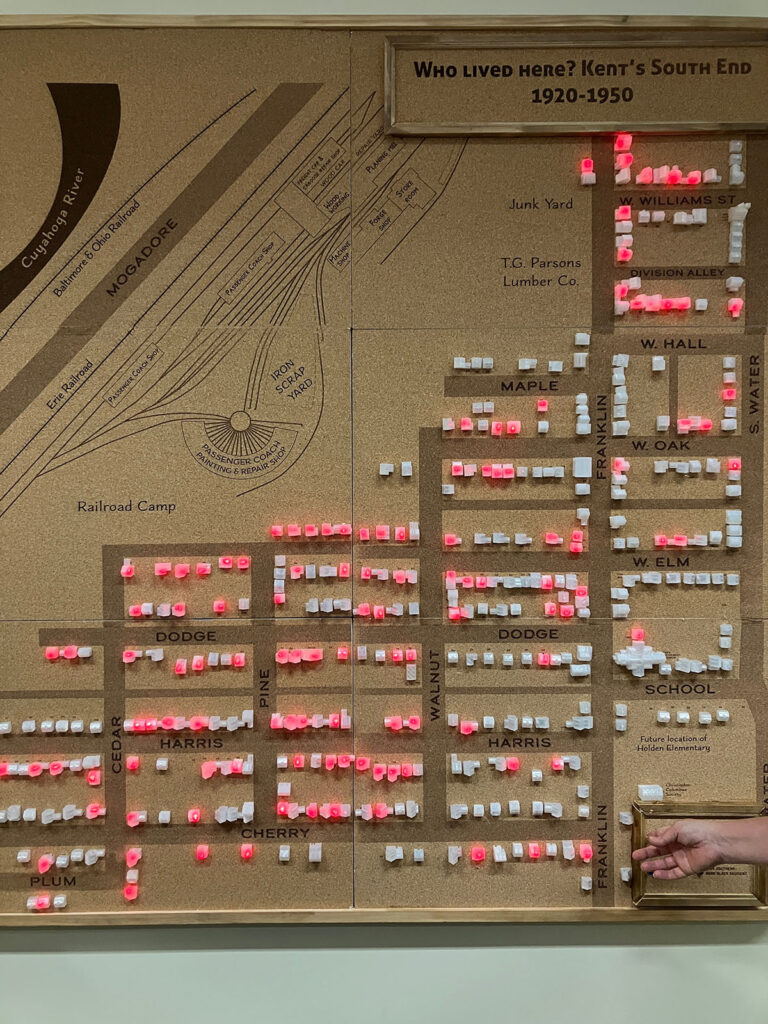
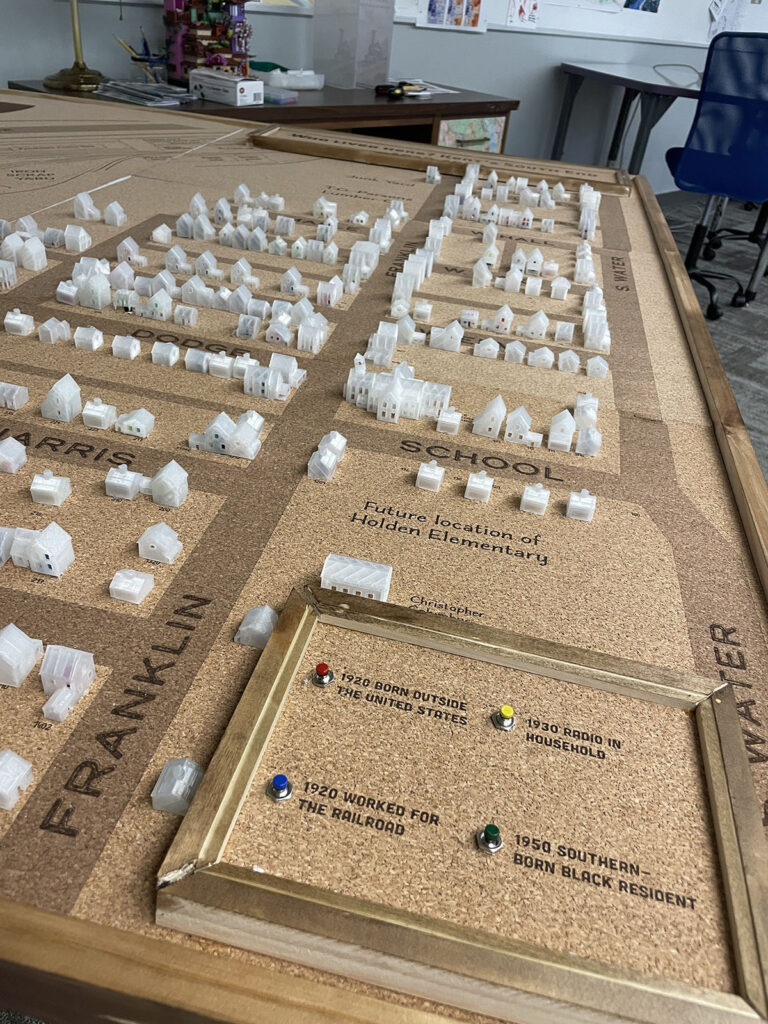
The map is 60”x60” and includes 350 3D printed transparent houses representing 25 different house styles in Kent’s South End. I’ve wired the map to light up based on answers to questions about the history each house’s resident based on census records.
- Which houses did railroad workers live in in 1920? (red)
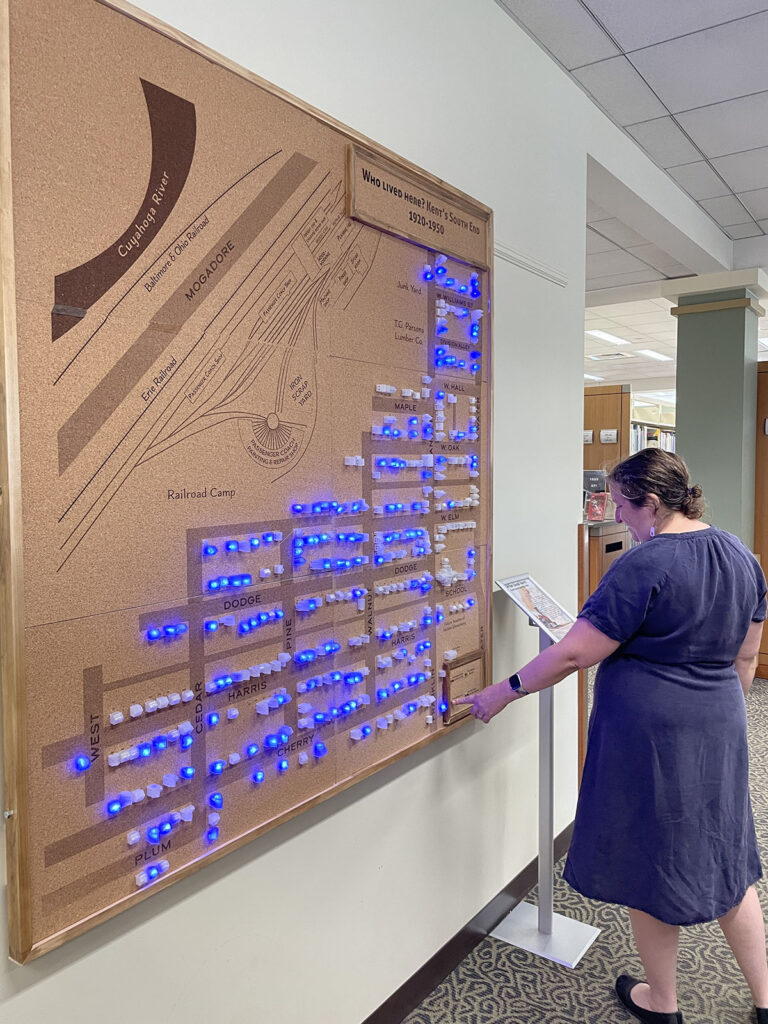
- Which houses did people not born in the U.S. live in in 1920? (blue)
- Who owned a radio in 1930? (yellow)
- Where did African-Americans, born in Southern states, live in 1950? (green)
The map is on exhibit at the Kent Free Library in Fall 2025 and the Kent Historical Society Museum starting Spring 2026.